
Tracely
Production failures become regression tests.
Trace-native CI/CD for AI agents. Tracely grades every agent trace as it lands, clusters the failures into issues, freezes the bad runs into hermetic replayable cases, blocks the pull request that would ship them again — and tells you the moment any of it happens.
production trace → failure detection → regression test → CI gate → alert
Website · Docs · Product guide · Agent skill · Guided tour · 2-min demo · Design dossier





Self-host the whole stack in one click — API, worker, UI, Postgres, ClickHouse, Redis and MinIO:

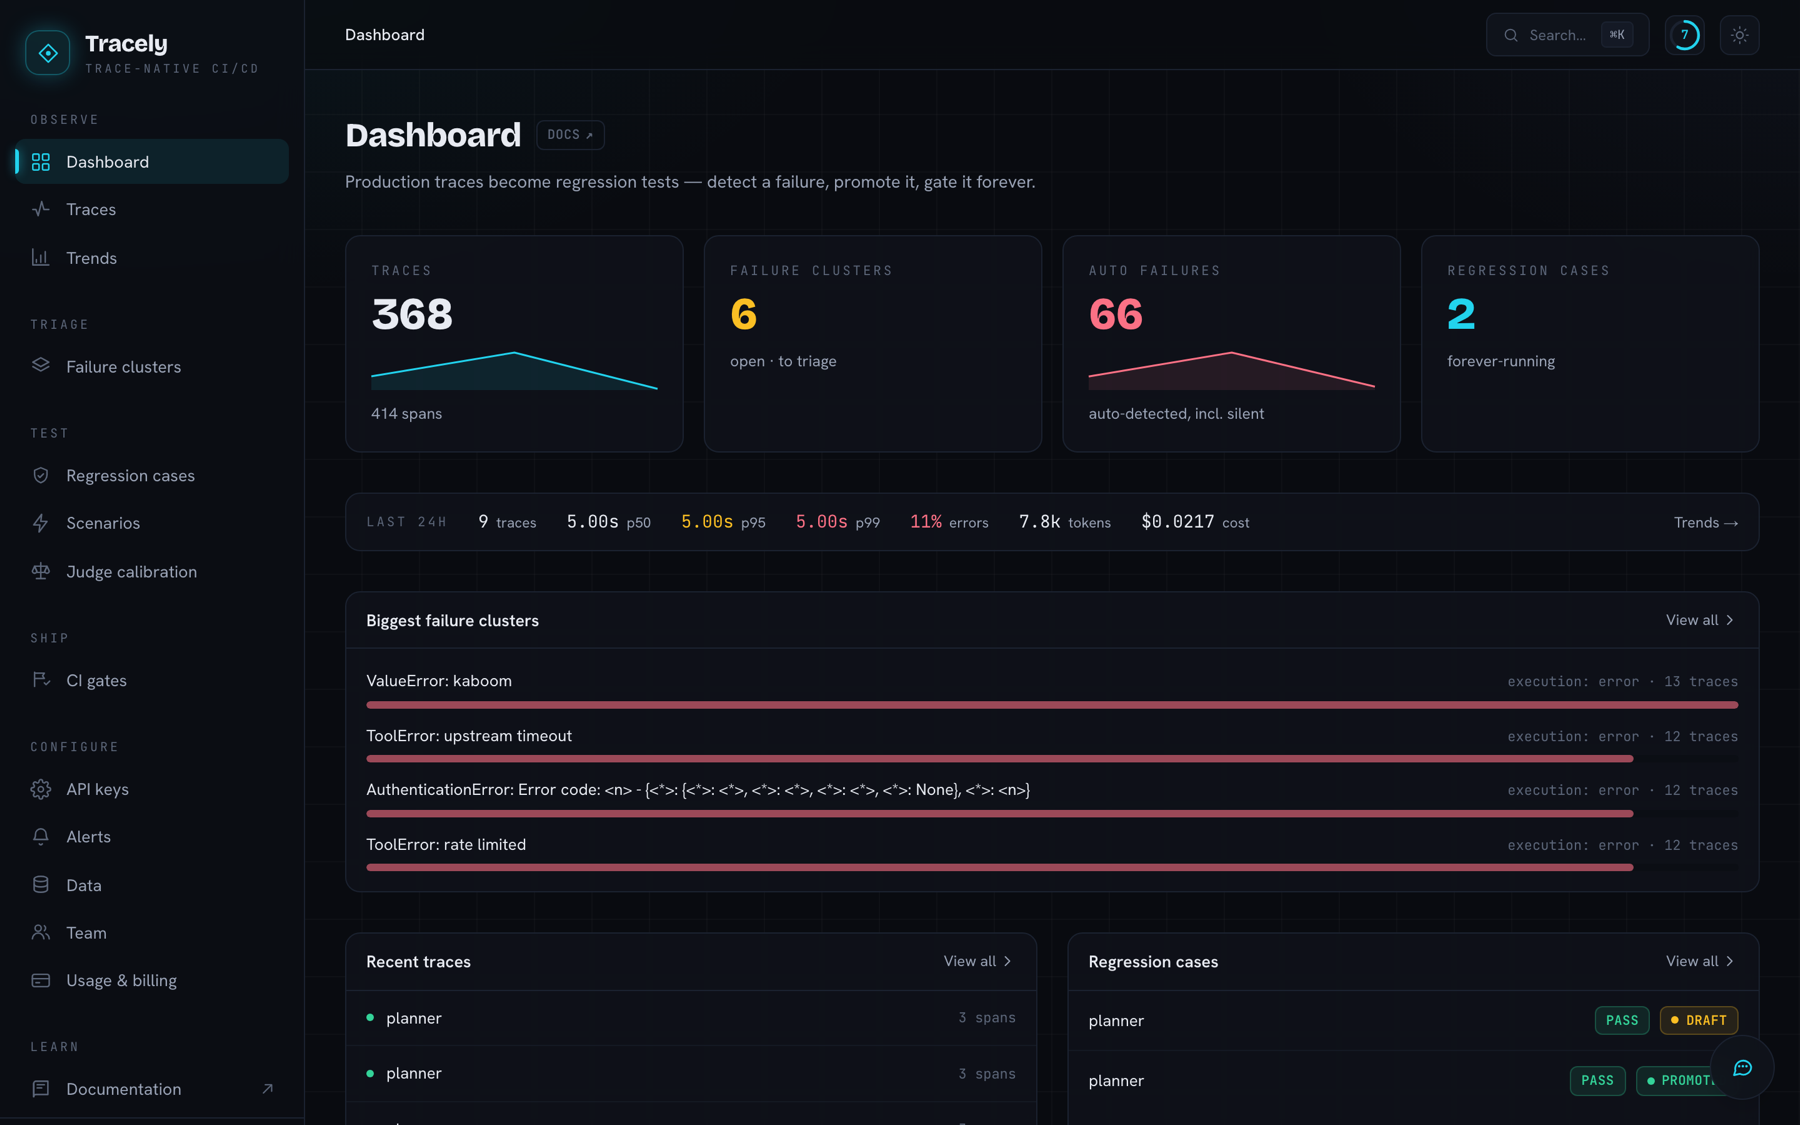
One workspace: what ran, what broke, what is already pinned as a test.
Why another agent-observability tool?
Because observability stops at the dashboard. You can see that your agent broke — then what?
Every eval tool asks you to hand-author a dataset: sit down, invent questions, write ideal answers, keep them current as the product changes. That dataset is a guess about what might break.
Production already handed you the real thing: a trace of the exact run that failed, with the exact input, the exact tool calls, the exact model responses.
The recorded run is the test. Tracely freezes that trace into a hermetic regression case and replays it on every PR. Everything else — quality scores, failure clusters, suggested fixes, CI verdicts, trends, alerts — is derived from the trace. There are no hand-authored datasets.
| Dataset-first tools | Tracely | |
|---|---|---|
| Where tests come from | You write them | Promoted from real failing traces |
| Fidelity to production | A guess | The exact failing run, byte for byte |
| Cost to replay in CI | Live model calls | $0 — recorded tool/LLM fixtures |
| What happens on regression | A dashboard number moves | The PR is blocked |
| How you find out | You go and look | It comes to you — Slack, email, your own webhook |
The loop
Five steps, five pages in the app.
1 · Observe — every run, hierarchically
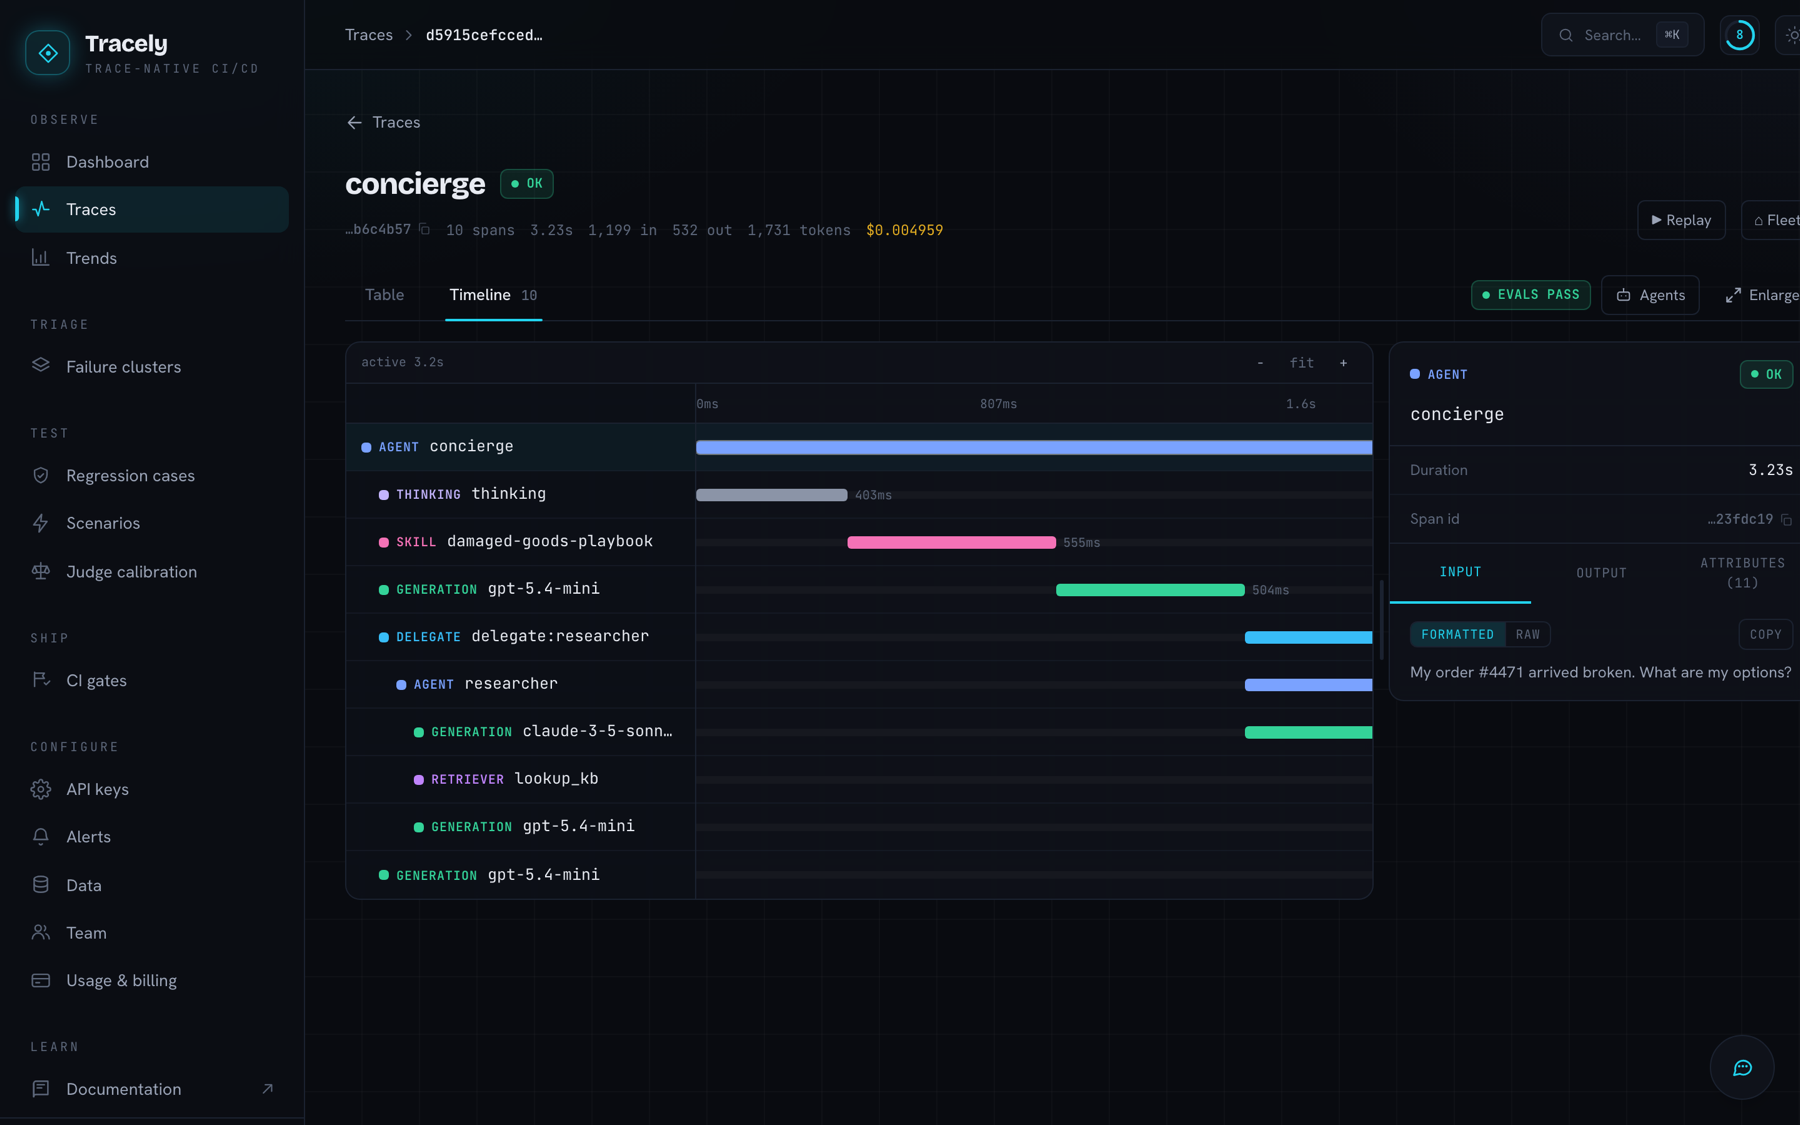
Traces arrive over plain OTLP. Agent semantics (agent.id, conversation.id, turn, step) are
promoted to first-class indexed columns, so runs group into conversation threads instead of a flat
span soup. The waterfall shows agent → thinking → skill → generation → hand-off, with the failing
span in red and its I/O beside it.
Evaluators are columns on the trace table, not a separate tab — each one grades at conve