StackMap
Subscribe
Explore / Understand-Anything
Egonex-AI

Understand-Anything

Plugin for Claude Code and 16 other hosts that turns any codebase into an interactive knowledge graph — multi-agent analysis, layered dashboard, guided tours, diff-impact view, domain mapping.

74,521 6,206 TypeScript MITupdated yesterday
Curator's take

The onboarding killer app, and its motto is the right one: graphs that teach, not graphs that impress. /understand runs a multi-agent pipeline over the repo, then the dashboard gives you architecture layers, dependency-ordered guided tours, semantic search, diff blast-radius, and a business-domain view that maps code to real processes. The team trick is the sleeper: the graph is plain JSON — commit it once and every teammate skips the analysis. Incremental re-runs + a post-commit auto-update hook keep it fresh. Budget real tokens for the first full run on a large repo (their own warning), or point it at a local model. NOT an agent context server — this graph is for humans first; when you want a code graph served TO agents over MCP, that's codegraph-mcp or tokensave territory.

Mapped by ShipWithAI editors · links verified
README.md

Understand Anything

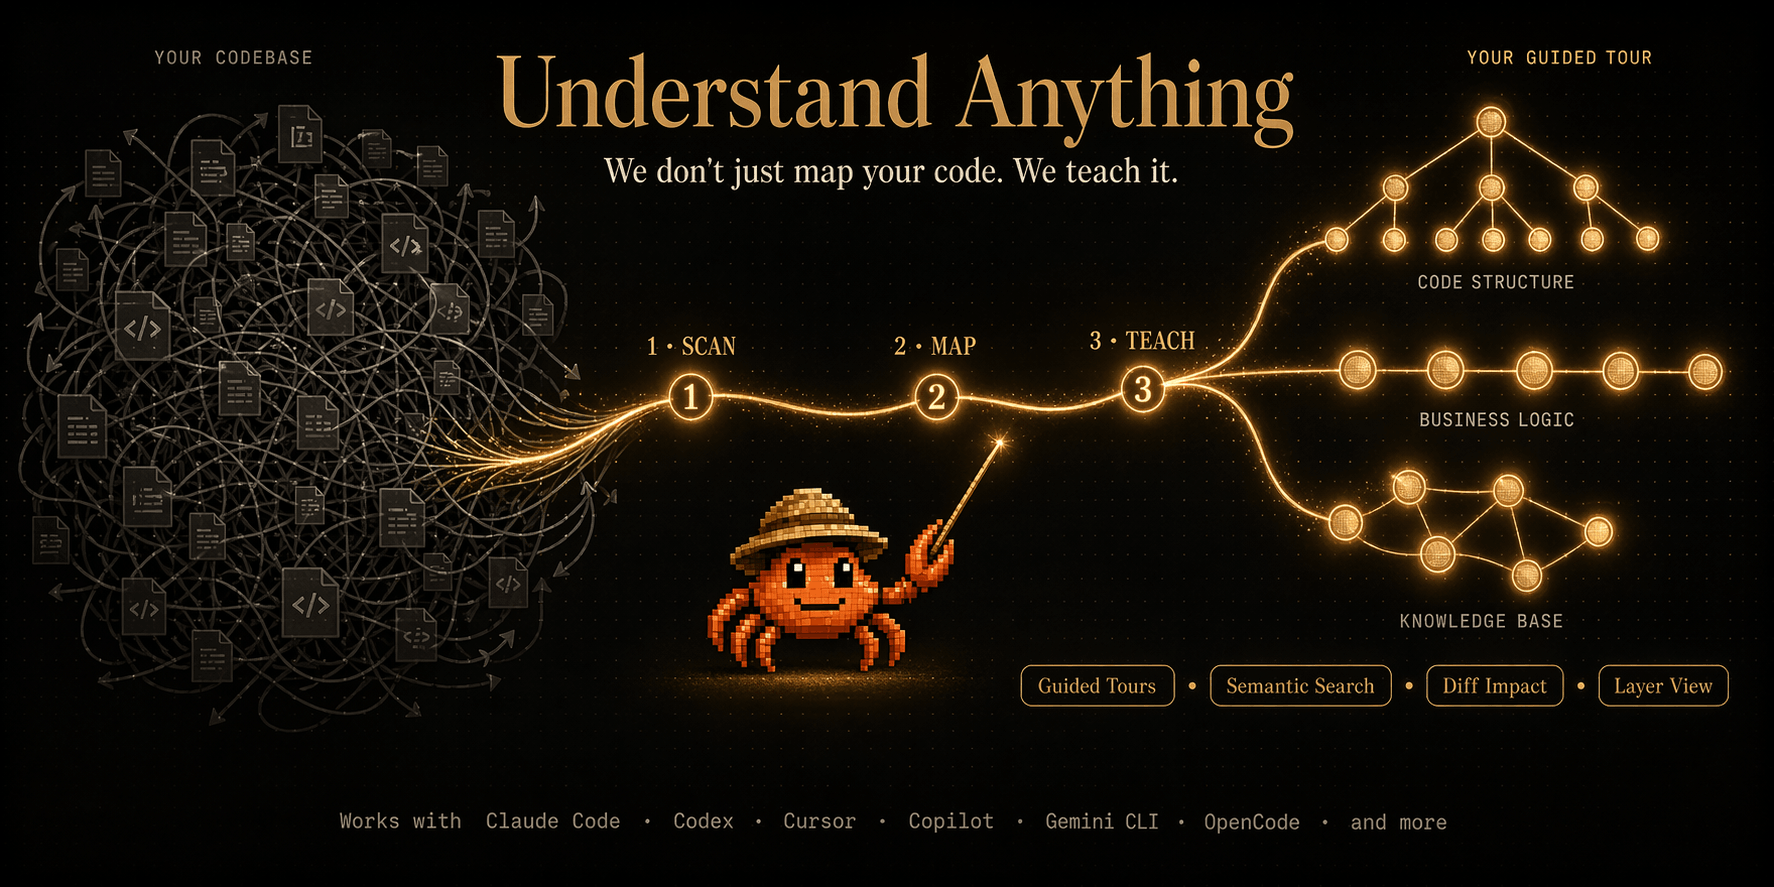
Turn any codebase, knowledge base, or docs into an interactive knowledge graph you can explore, search, and ask questions about.
Works with Claude Code, Codex, Cursor, Copilot, Gemini CLI, and more.

Understand Anything. Understand Anyone.
AI should help people, not replace them.

Understand Anything | Trendshift

English | 简体中文 | 繁體中文 | 日本語 | 한국어 | Español | Türkçe | Русский

Quick Start License: MIT Claude Code Codex Copilot Copilot CLI Gemini CLI OpenCode Vibe CLI Trae Homepage Live Demo Understand Anyone

Understand Anything — Turn any codebase into an interactive knowledge graph

An open-source project from Egonex
Originally created by Lum1104.


You just joined a new team. The codebase is 200,000 lines of code. Where do you even start?

Understand Anything is a Claude Code Plugin that analyzes your project with a multi-agent pipeline, builds a knowledge graph of every file, function, class, and dependency, then gives you an interactive dashboard to explore it all visually. Stop reading code blind. Start seeing the big picture.

The goal isn't a graph that wows you with how complex your codebase is — it's a graph that quietly teaches you how every piece fits together.


✨ Features

[!NOTE] Want to skip the reading? Try the live demo in our homepage — a fully interactive dashboard you can pan, zoom, search, and explore right in your browser.

Explore the structural graph

Navigate your codebase as an interactive know

Continue your stack

What teams reach for next — and why each earns a place beside Understand-Anything. Ranked by curator confidence.