SiliconScope
English · Deutsch · 简体中文 · 繁體中文 · 日本語 · 한국어





A sudoless Apple Silicon system monitor — a native SwiftUI dashboard and a full menu-bar suite — with first-class ANE (Neural Engine), Media Engine, and memory-bandwidth tracking that Activity Monitor and terminal monitors don't surface.
Born from wanting to see how on-device AI and media workloads drive the Apple Silicon accelerators — and grown into a daily-driver monitor that can stand in for iStat Menus.
Featured on AAPL Ch. (JP) and ifun.de (DE).
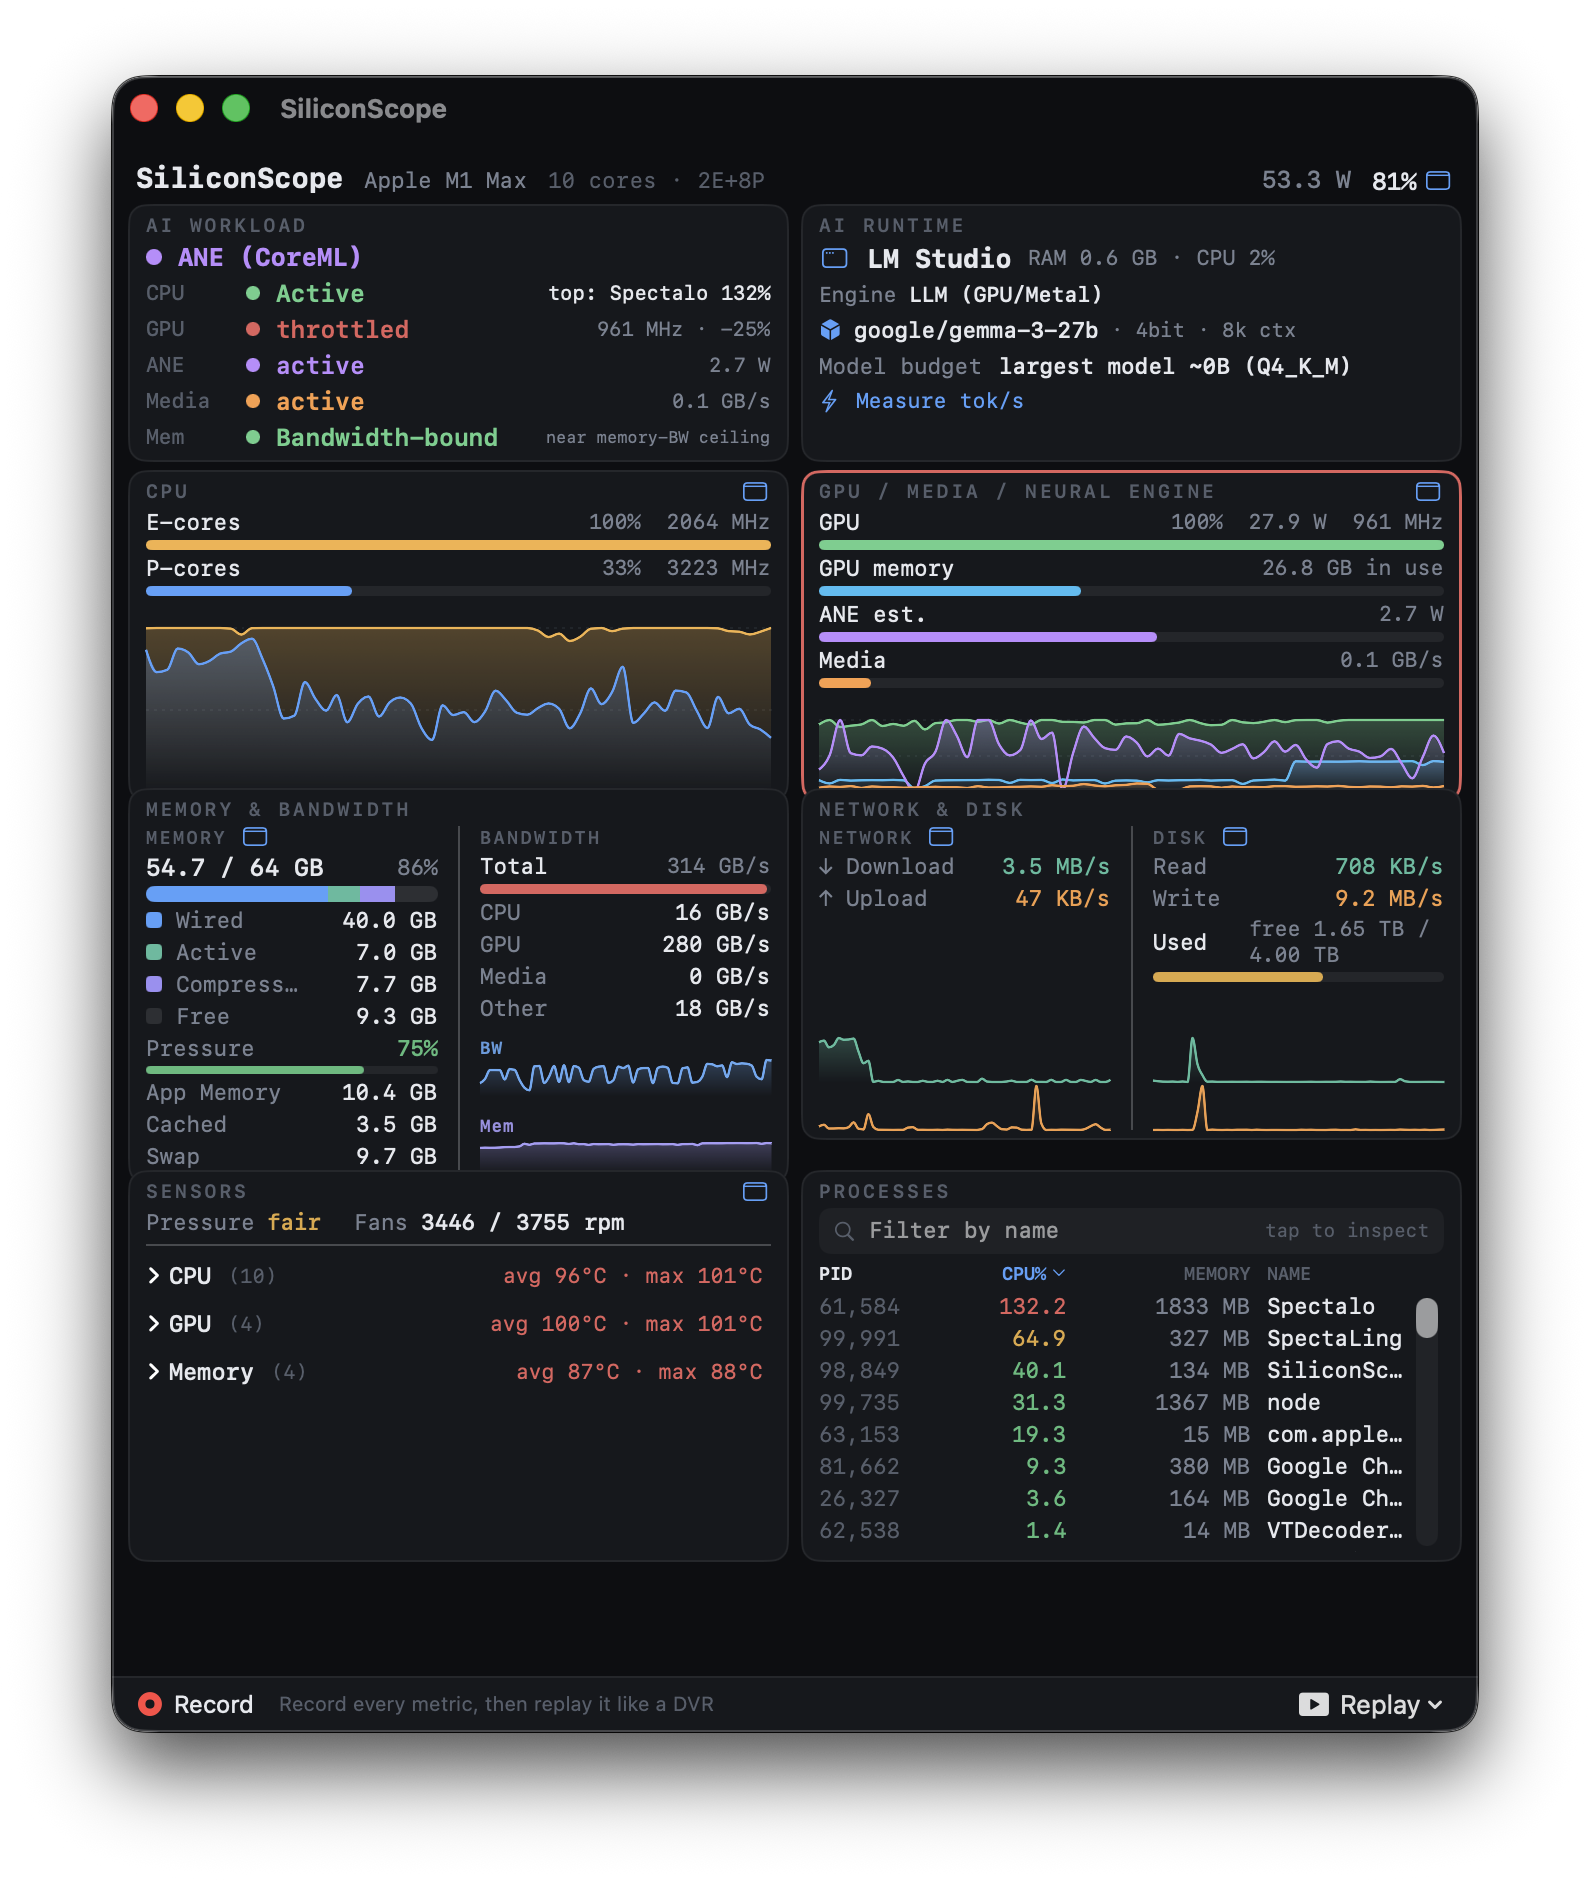
The whole machine at a glance — an AI-workload bottleneck classifier, E/P-core overlaid trends, GPU / GPU-memory / ANE / Media, memory measured against the M1 Max's 400 GB/s ceiling, per-core temperatures, power, and live processes. The bar along the bottom is Replay (new in 3.0): every metric is recorded, so you can scrub back through a session like a DVR.
Menu bar — every metric, iStat-style
Pin any card to its own menu-bar item — CPU · GPU · Memory · Network · SSD · Sensors · Battery — each with a live glyph and a rich dropdown. All sudoless.

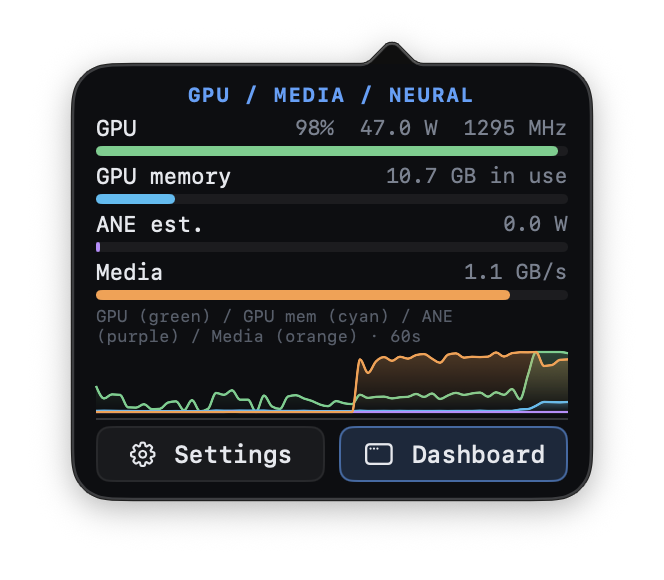
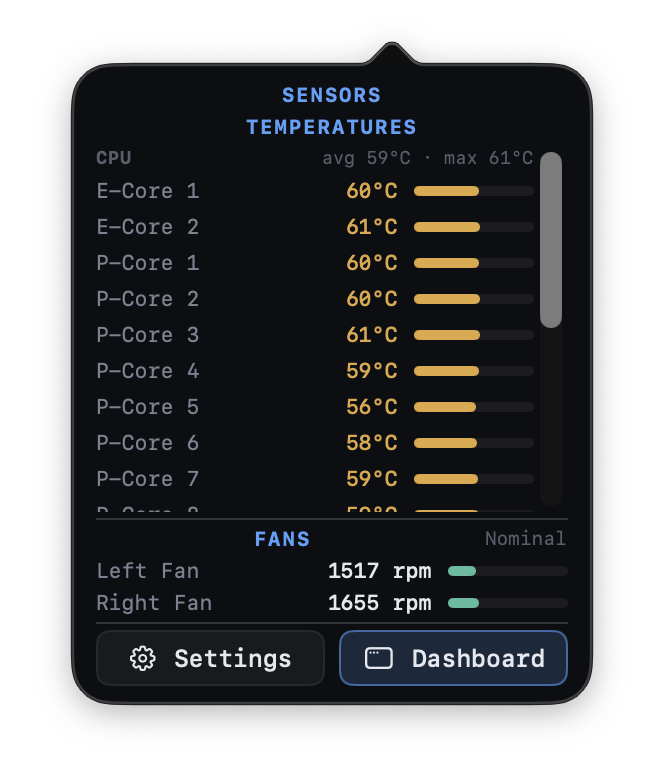
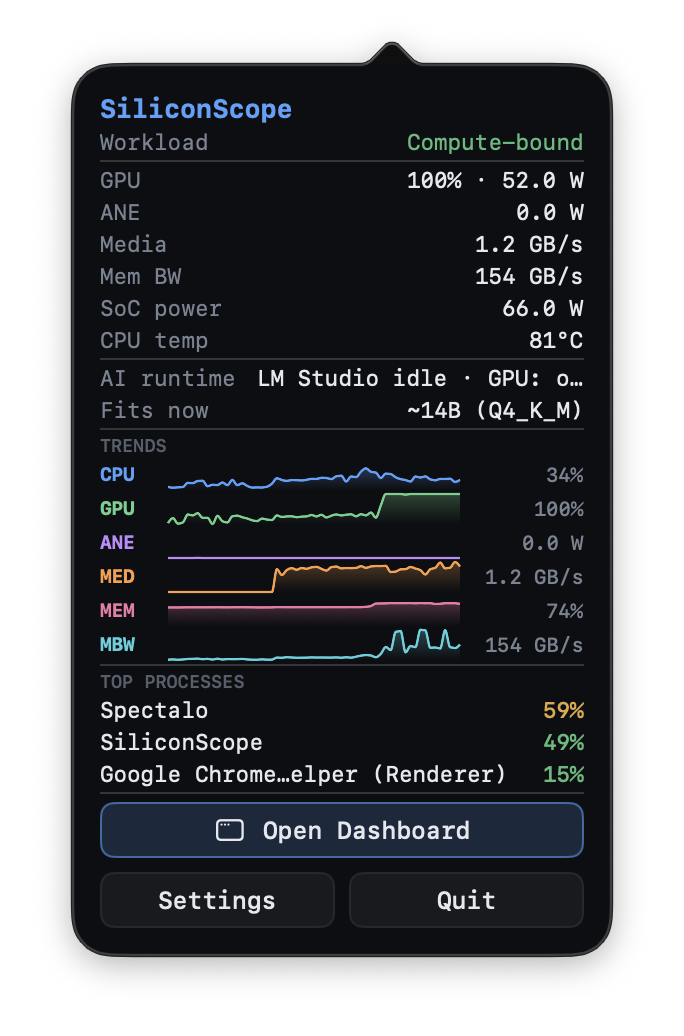
The richest dropdowns. GPU / Media / Neural — GPU, GPU memory, ANE and Media as live meters plus a four-line 60-second trend. Sensors — per-unit temperatures from real E-Core / P-Core / GPU / Memory sensors (curated SMC keys per chip generation, M1–M5; HID fallback elsewhere). SS cockpit — the whole machine in one dropdown: workload verdict, every engine, 60-second trends, and the top processes.

On-demand benchmark: "Measure tok/s" runs one short generation and reports the model's decode speed and energy efficiency — tokens/sec · tokens/Wh — stored per model.
📊 Measured tok/s on your Mac? Post it in Discussions — a crowd-sourced per-chip table helps others pick the right hardware.
New in 3.0
🧠 Process Inspector — per-process metrics, sudoless
Click any process to open the Inspector. It shows what Activity Monitor can't: CPU (P/E split) · IPC · per-process power (W) · memory · disk — each with a live sparkline — and the one signal nobody else surfaces per process: Neural-Engine memory. See exactly which app is on the ANE, and how much it's holding.
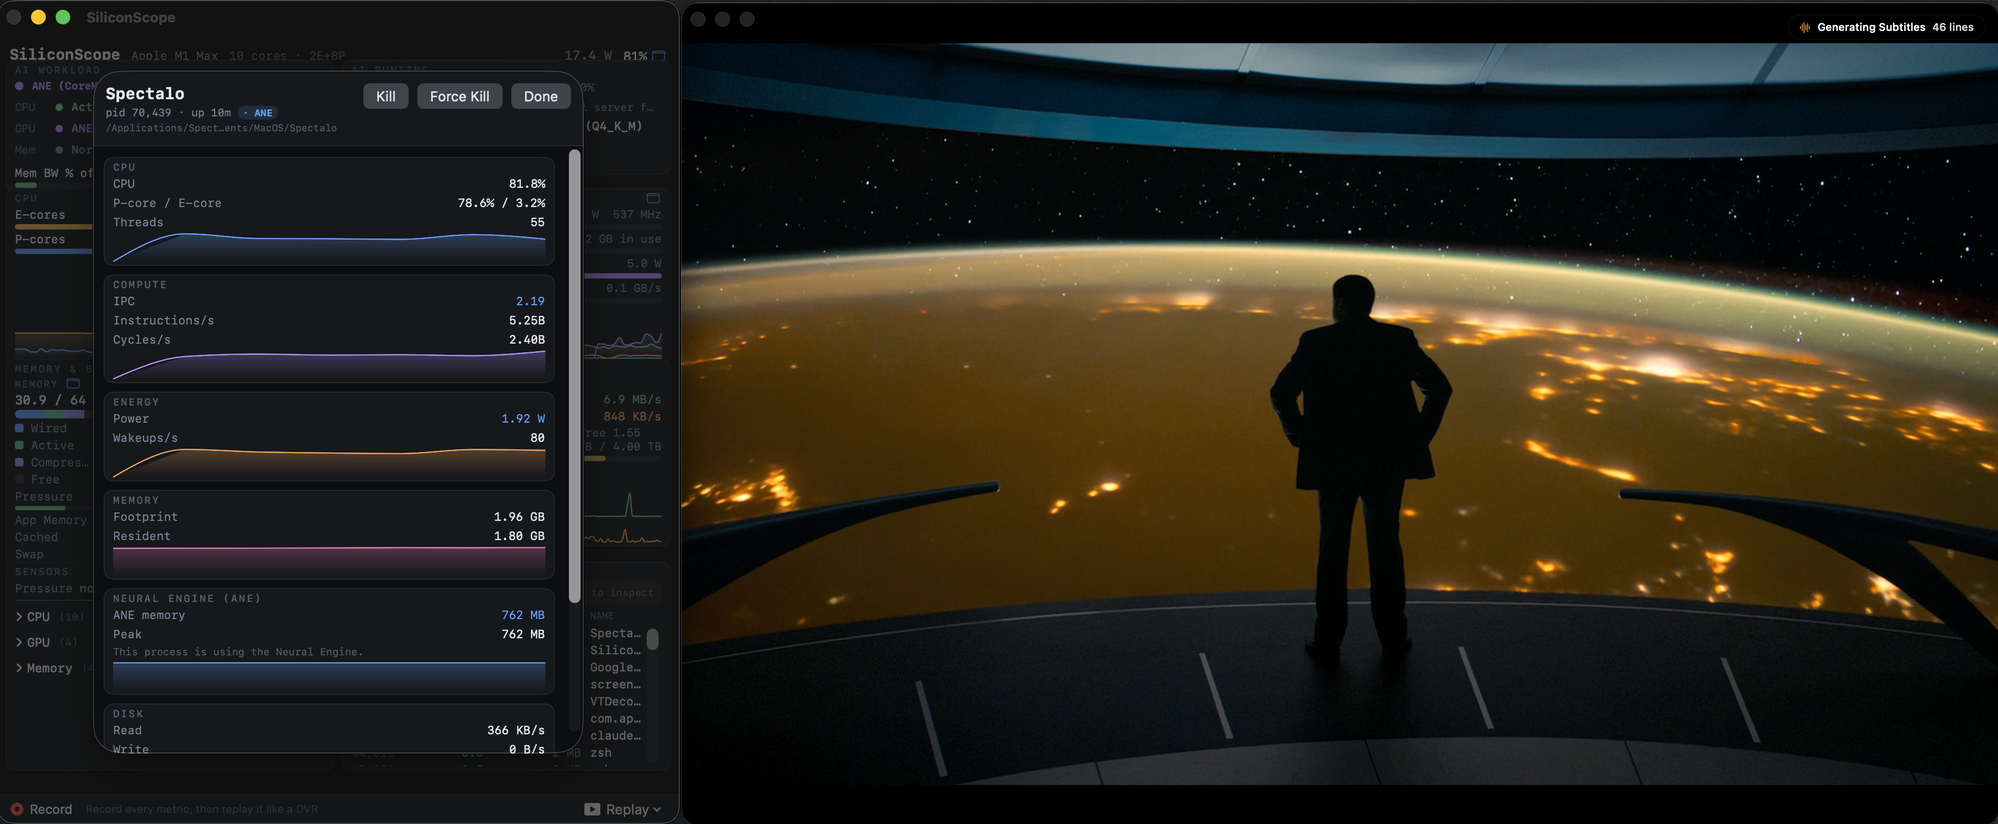
*An on-device transcription app running live (rig