README.md2 min read
AI Token Monitor


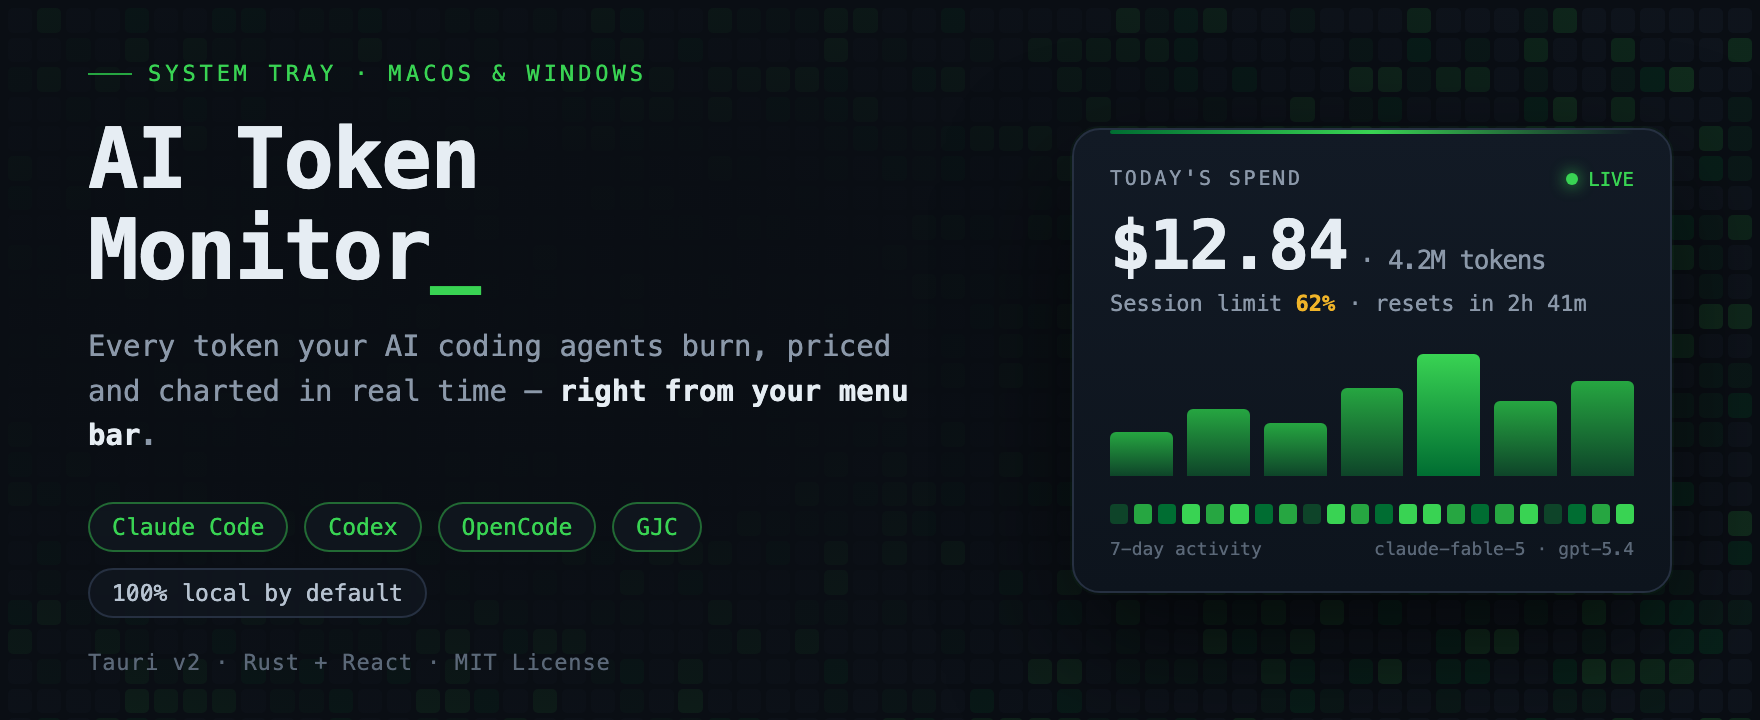
AI Token Monitor is a lightweight system tray app for macOS and Windows that answers one question, all day long: how much are my AI coding tools actually costing me? It reads the local session logs that Claude Code, Codex, OpenCode, and GJC already write, prices every token with per-model rates (cache reads included), and puts today's spend right next to your clock — with charts, plan-limit alerts, an opt-in leaderboard, chat, and webhook notifications one click away.
- Zero setup — no API keys, no proxies. If you've run Claude Code or Codex once, it just works.
- Spend at a glance — live cost in the menu bar / system tray, full dashboard on click.
- Stay ahead of limits — live 5-hour session & weekly plan bars, plus Discord / Slack / Telegram alerts before you hit the wall.
- Private by design — 100% offline by default; leaderboard, chat, and webhooks are strictly opt-in.
| Overview | Analytics | Leaderboard |
|---|---|---|
 |
 |
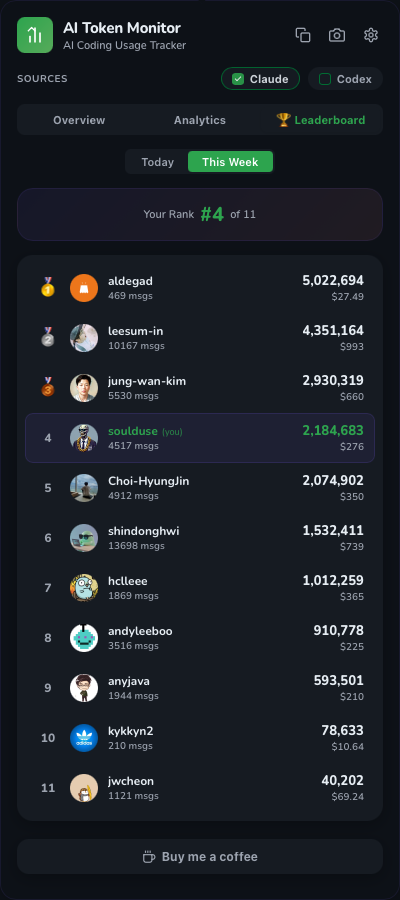 |
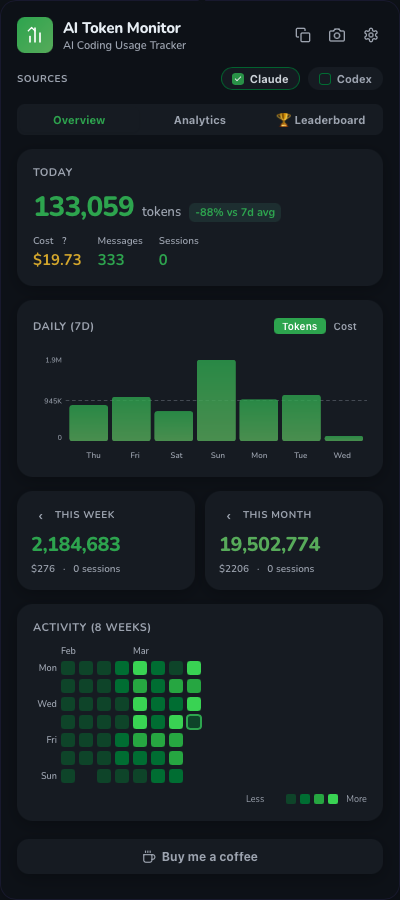
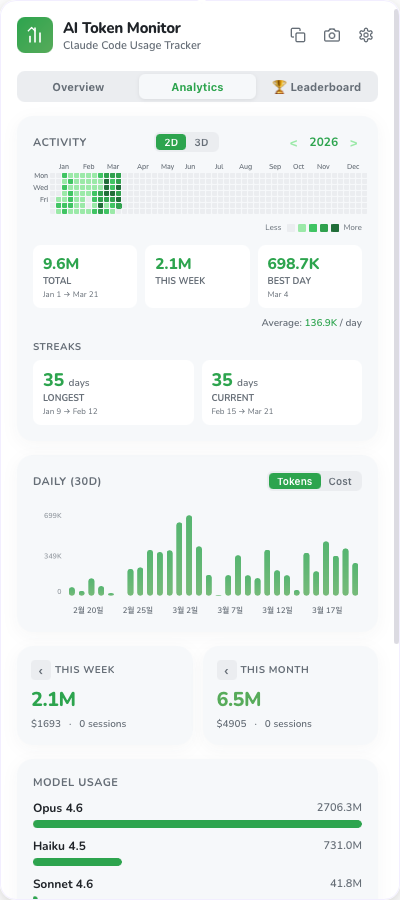
| Today's usage, 7-day chart, weekly/monthly totals | Activity graph, 30-day trends, model breakdown | Compare usage with other developers |
Download
| Platform | File | Notes |
|---|---|---|
| macOS (Apple Silicon) | .dmg |
Intel Mac support coming soon |
| Windows | .exe installer |
Windows 10+ (WebView2 required, auto-installed) |
How It Works
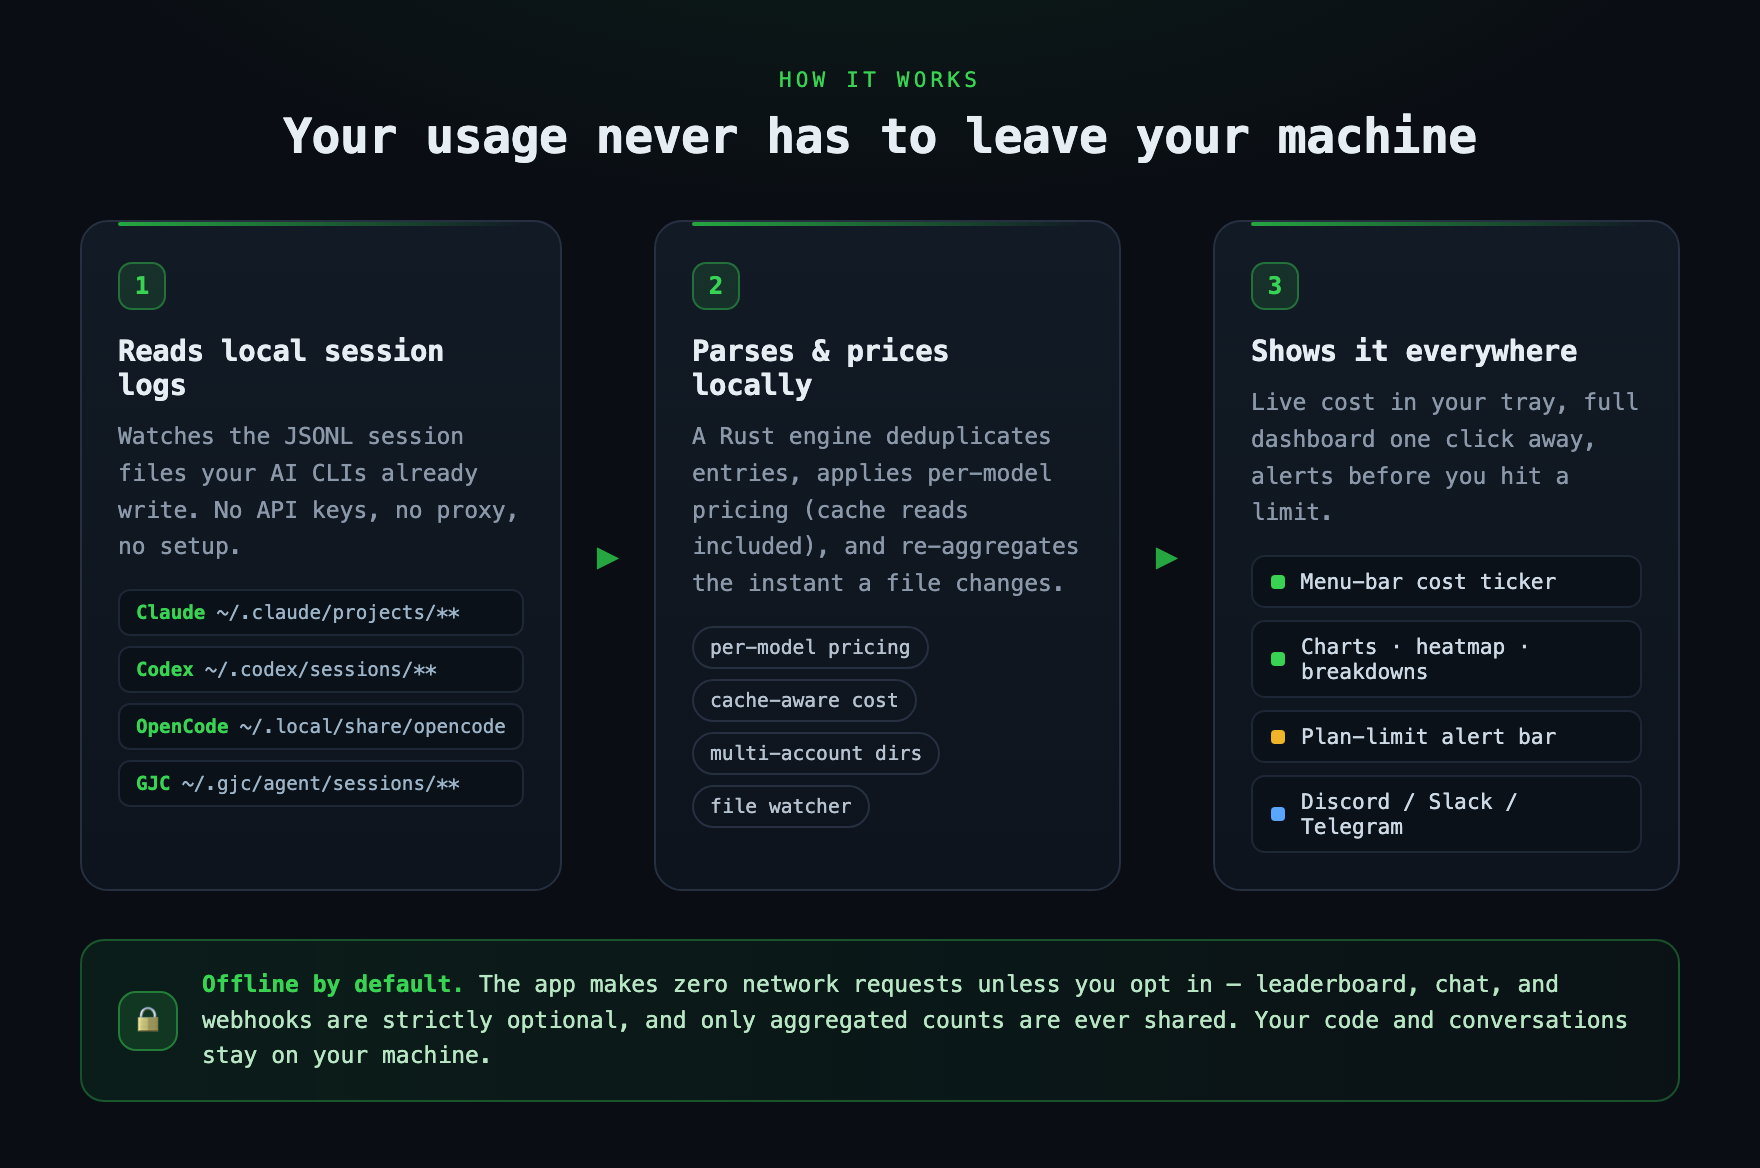
- Reads local session logs — watches the JSONL files your AI CLIs already write (see Data Sources for exact paths)
- Parses & prices locally — a Rust engine deduplicates entries, applies per-model pricing (cache reads included), and re-aggregates the moment a file changes
- Shows it everywhere — tray cost ticker, dashboard charts, plan-limit alert bar, and optional webhook notifications
Everything above happens on your machine. The app makes zero network requests unless you opt in to the leaderboard, chat, or webhooks — and even then only aggregated counts are shared, never code or conversation content.
Features
Tracking & Visualization
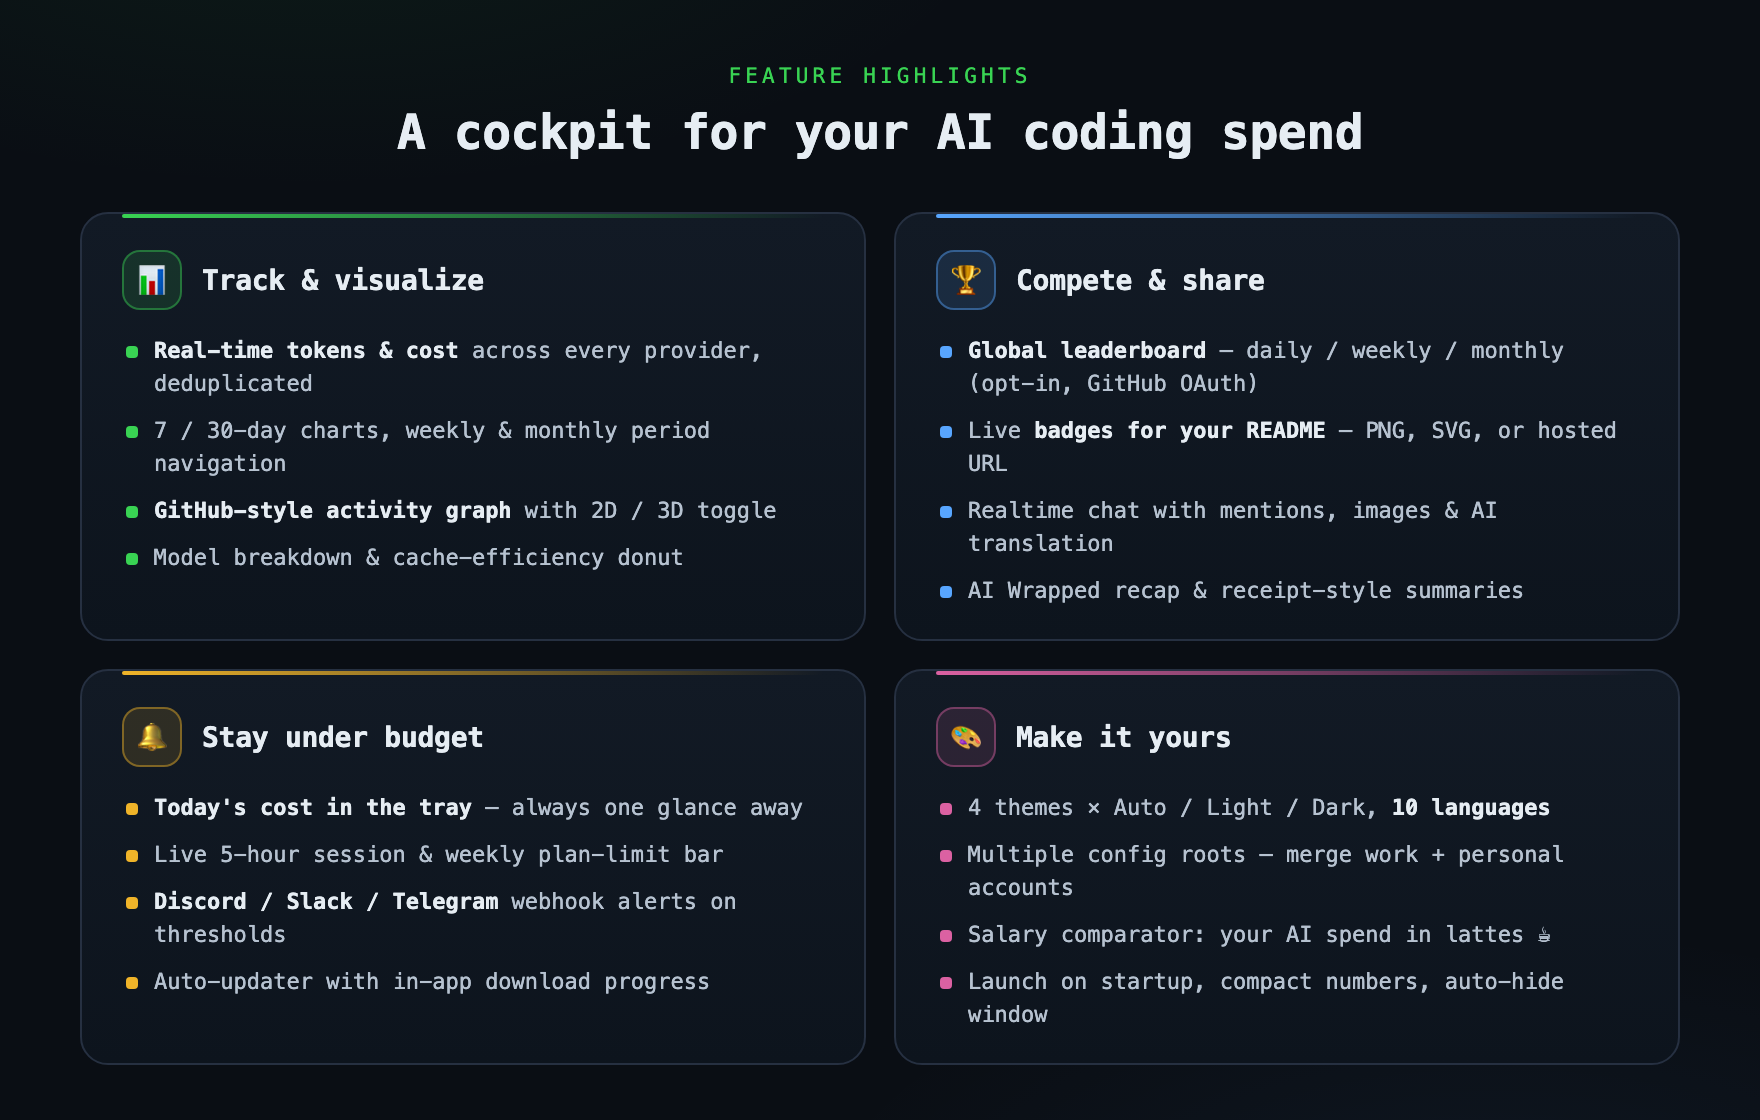
- Real-time token tracking — parses session JSONL files from Claude Code, Codex, and OpenCode for accurate usage stats
- Multi-provider support — switch between Claude / Codex / OpenCode sources, with per-provider cost models
- Multiple config directories — aggregate work + personal accounts by adding several Claude/Codex roots
- Daily chart — 7/30 day token or cost bar chart with Y-axis labels
- Activity graph — GitHub-style contribution heatmap with 2D/3D toggle and year navigation
- Period navigation — browse weekly/monthly totals with
< >arrows - Model breakdown — Input/Output/Cache ratio